
Have you made any infographics for your blog? If not, this is a must-read guide about Infographics for SEO so that you can create infographics and get backlinks. You will know how it will benefit your website after reading this post till the end.
Infographics are visual images that represent data. Using them on your website attracts traffic when people search for images. Also, relevant blogs give backlinks if your infographic is unique and exciting.
Want to know more about SEO infographics? This part is a must-read. Read thoroughly until the end, and you can also make infographics for your blog post.
Do infographics help in SEO?
Infographics are a type of image, and an image provides structure to a blog post. But that does not mean you can use images on the website every few lines.
Images also have higher chances of click-thru rate, which is highly beneficial to gain traffic on your website – Read this citation.
Infographics help in SEO for your website. If you have created a unique infographic, it may appear on the top of SERP as a google snippet, and people may click on it; thus, your website traffic can increase.
What are the advantages of using infographics in blogs and websites?
Let’s see some advantages of using infographics on your website and blog post.
- High chances of getting quality backlinks.
- Helps execute the call to action and conversion on your website.
- It can increase the traffic of your blog as people share them.
- Increases visitor retention on the website.
- Images are easy to understand.
Can search engines read infographics?
Search engines cannot read infographics, but users share and use them as they spend more time interacting with infographics and visual images. The search engines promote and rank them on the top and show other users.
How to create Infographic for free?
If you have basic designing skills, you can use tools such as adobe illustrator or photoshop to make infographics for your blog. But if this is your first time, you can use free tools from canva.
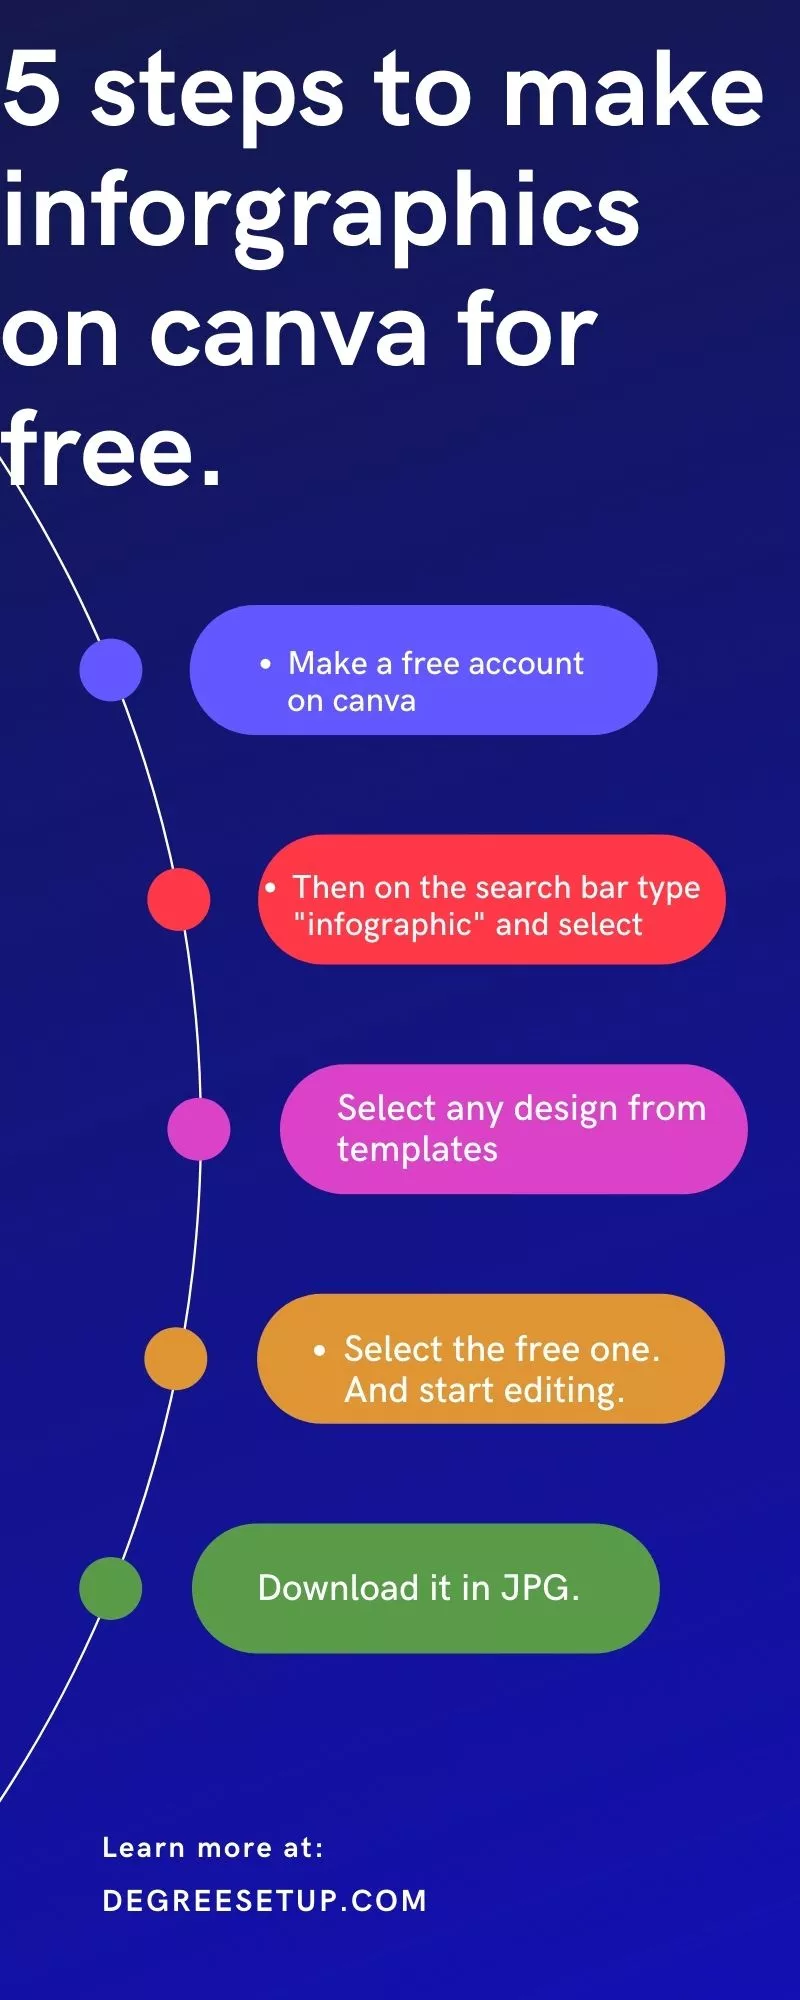
To make an infographic on canva, follow these steps.
- Step 1 – Make a free account on canva but to use more features, I recommend canva pro.
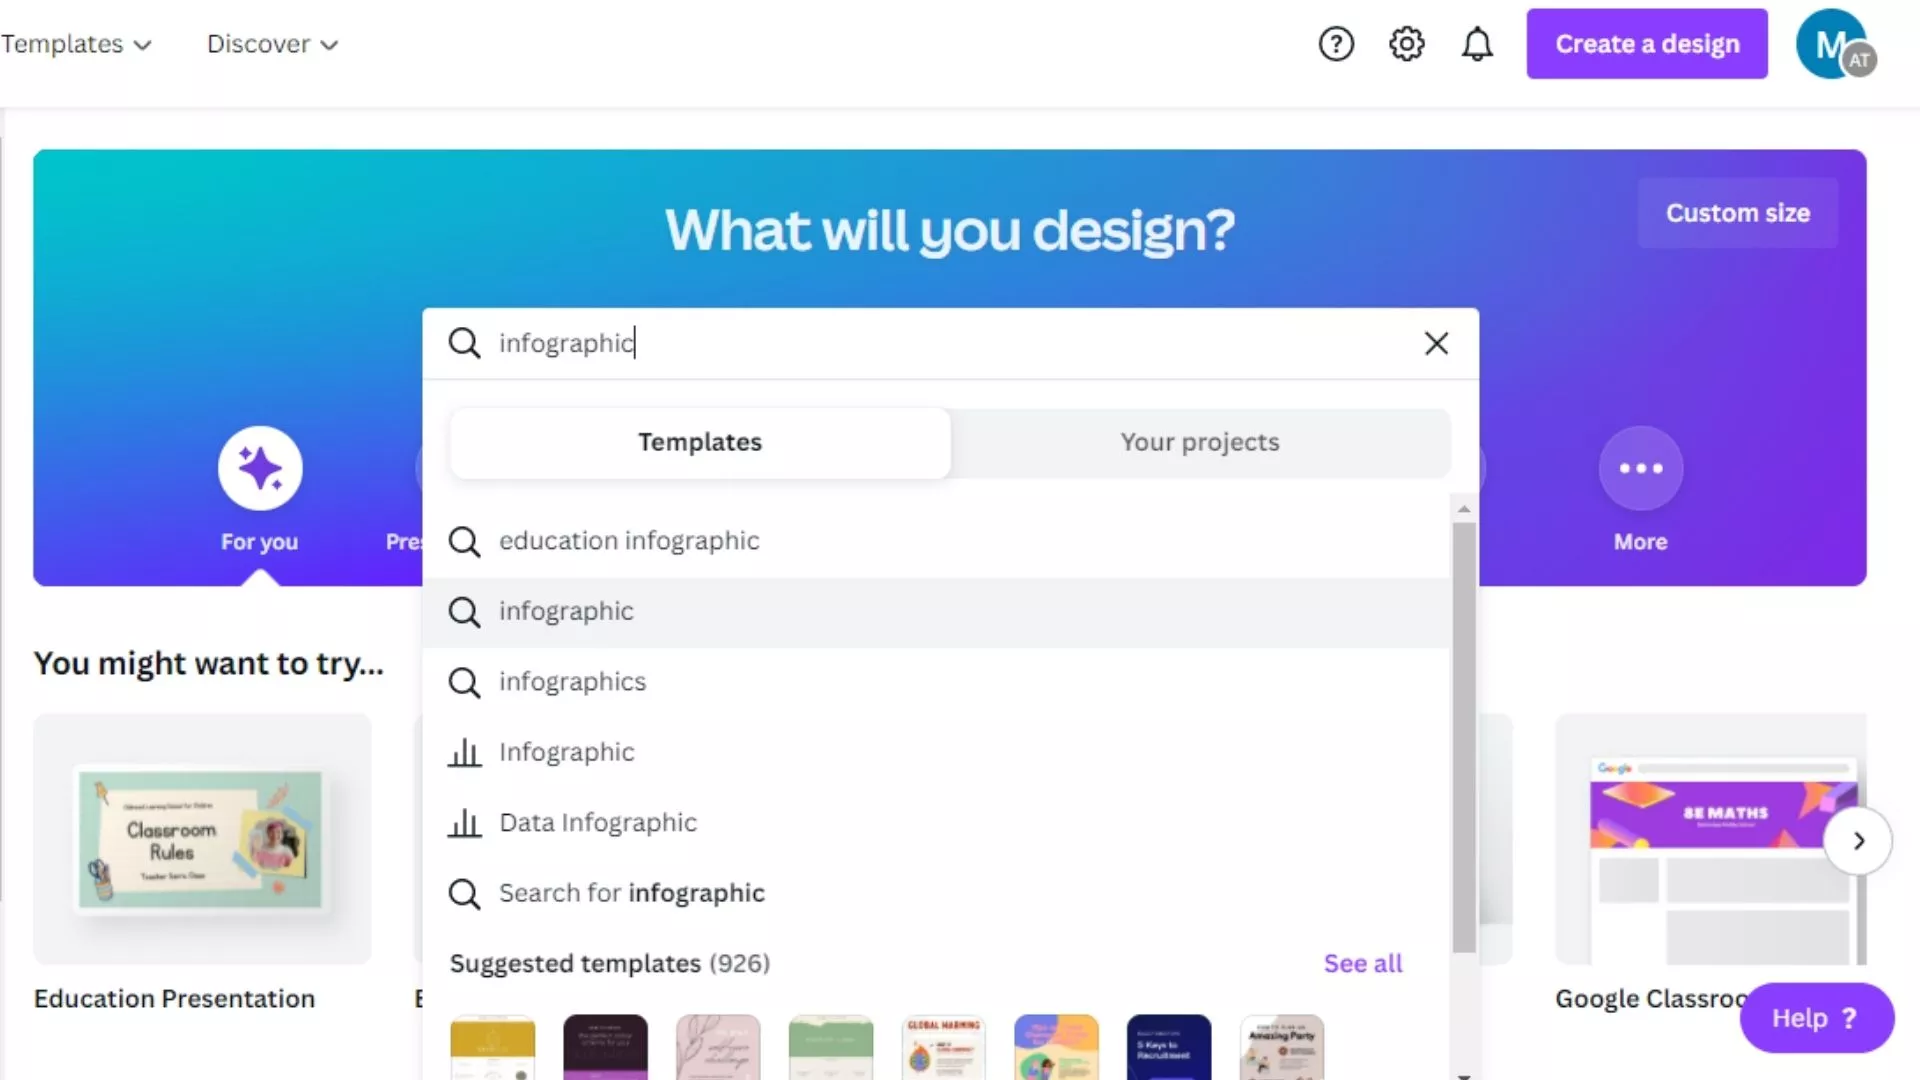
- Step 2 – On the search bar, type “infographic” and select.
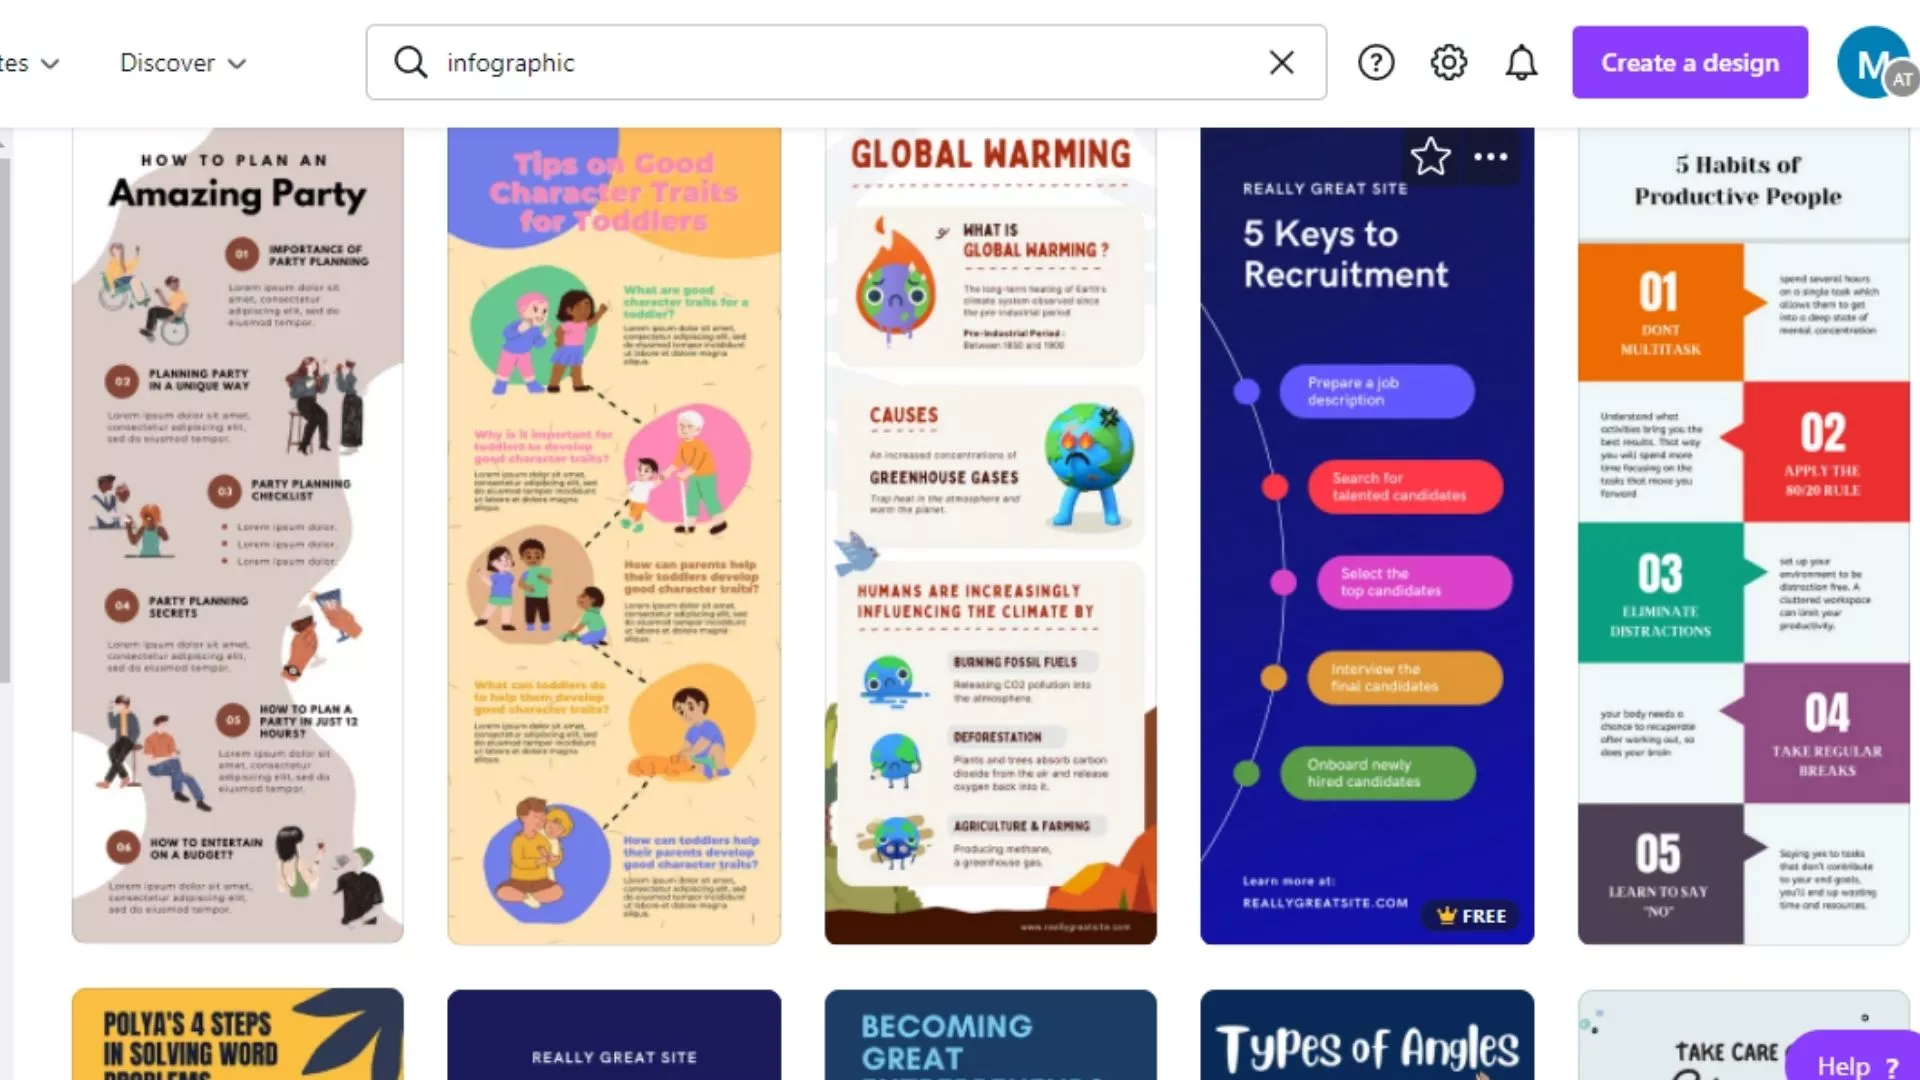
- Step 3 – You can see thousands of designs and pre-made templates.
- Step 4 – Select the free one. And start editing as per your need.
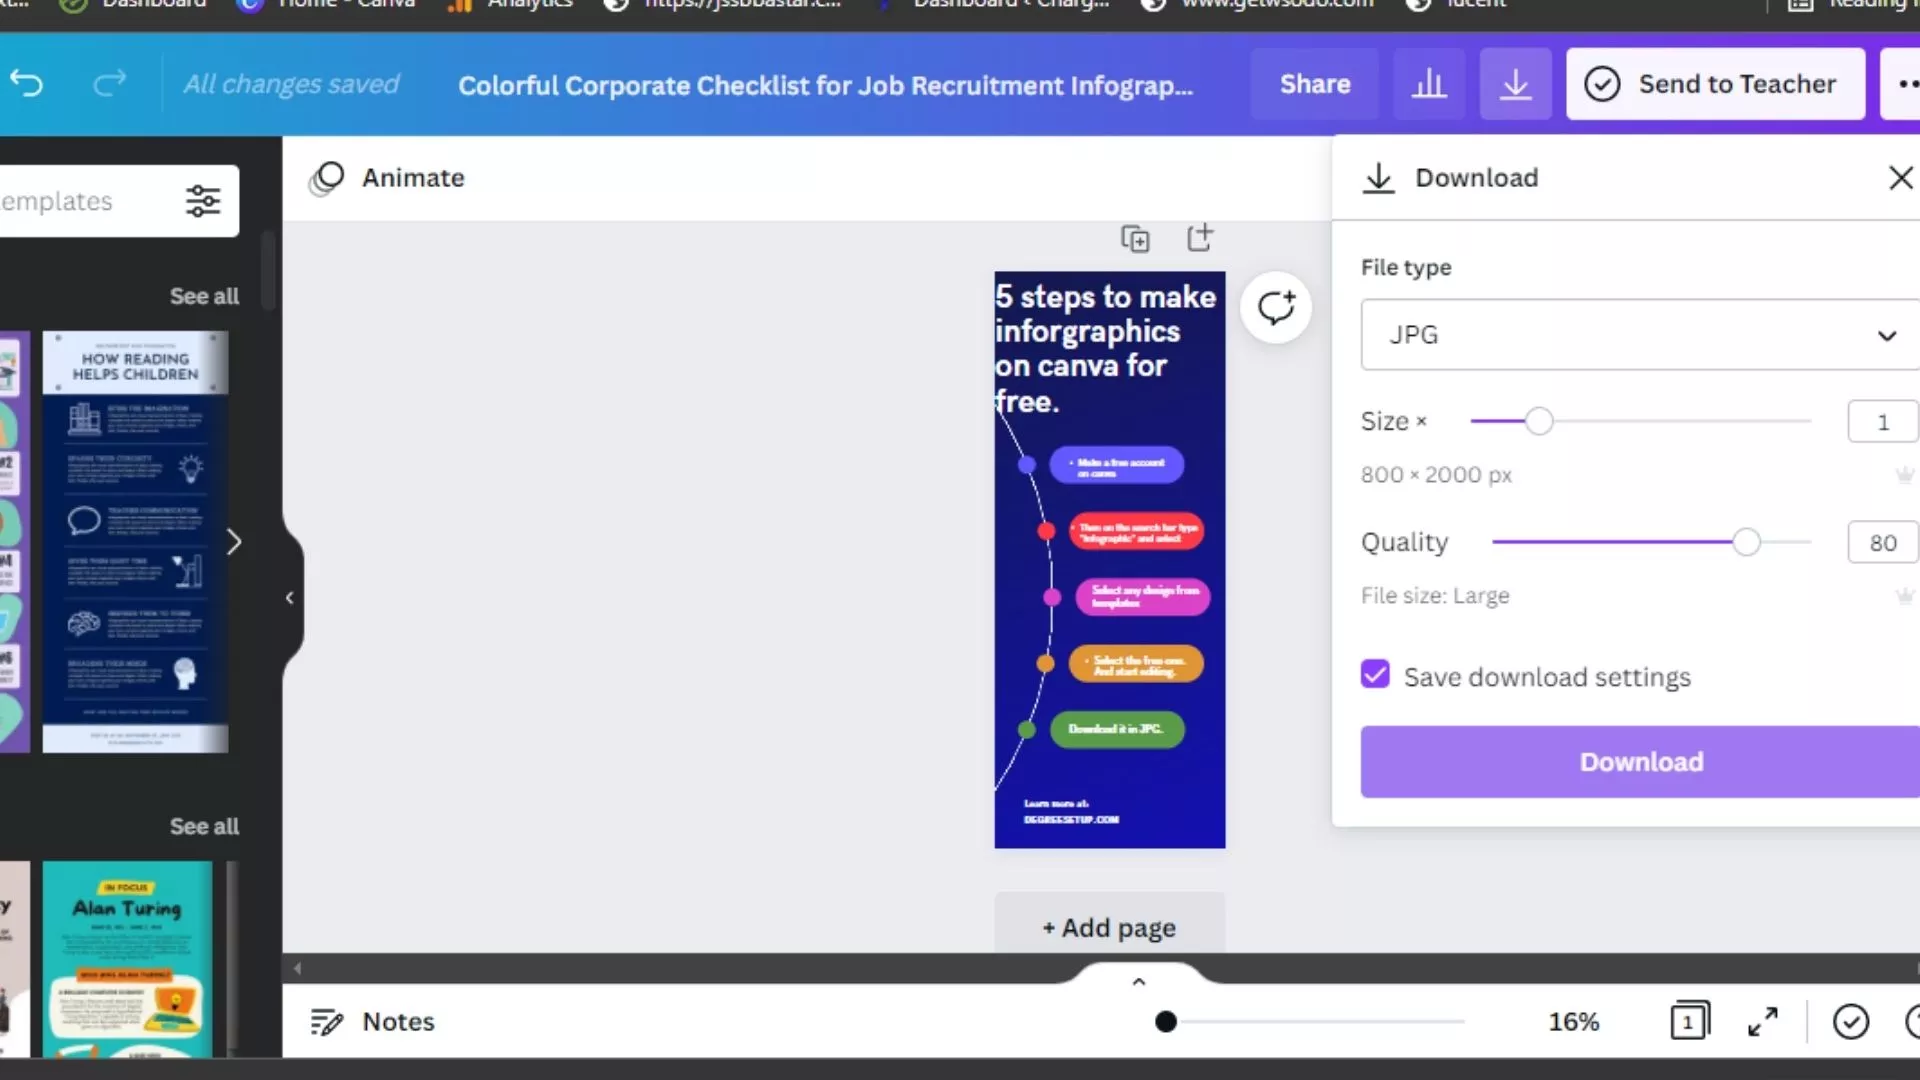
- Step 5 – Download it in JPG format.
Make sure to make your infographics unique. Avoid downloading infographics as it is just by replacing text. As it was to show only demo to you. Otherwise, you can change color and add images and elements to make your infographics more appealing.
Remember, Google only ranks unique and quality content that applies to images. If you have made logical images and pictures for your blog, it will surely rank on google.
How to make your infographics SEO friendly?
There are essential tips to make any image or infographic SEO friendly. Make sure to apply these tips to your other images on the website to get better results.
- Use images size of high resolutions.
- Use alt and title tags according to google image SEO guidelines.
- Avoid using too many stock images.
- Mention the source and link where you have taken the data in your images.
How many infographics should be there on a blog post?
There’s no limit to using infographics on a particular blog or website. However, using too many images and infographics can make your website slow.
Using 5-6 infographics of 100 Kb – 150 Kb in size on a single blog post page. Using more images can slow your site and even decrease your rankings.
So if you want to use a couple of images on your website, try to reduce the sizes of the pictures and use image formats such as JPG or WebP. I have written a post about WebP images. You can read it here.
How to use multiple infographics in a single post?
Images are good for SEO, but using multiple photos on one post can slowly load.
But there’s one solution you can use: users can use as many images they want, and your website speed will also not decrease.
If you are using WordPress, there’s an option called page break. Using it, you can break the pages into multiple ones. By which each runner will load separately.
For example – You want to write a blog post on “15 best SEO practices for newbies,” instead of writing it on one page, you can use a page break and divide it into three pages, and hence you will write five tips on each page.
In what type of post infographics are used?
Infographics can be used in any post you want, but using them on a specific post will help you get high traffic. As per my analysis, most bloggers and website owners use infographics on staple posts and very few in response posts.
Regarding staple posts, infographics are the type of posts you should use.
- How to post.
- The blog post includes steps.
- Guidepost.
- List-post.
These are some basic examples of blog posts where you can use infographics.
How to build quality backlinks with infographics?
Infographics are the best way to build natural links. You just have to create helpful infographics that should have information from authoritative sources.
Usually, it takes about 2-3 months for images to rank on search engines but you can make an extra effort to make your infographics rank faster and get backlinks.
Here are some tips that you can use
- Use low-competition keywords at first and then slowly pick up high-competition keywords. Include keywords in infographics too.
- Make similar infographics for social media accounts, especially Instagram and Pinterest, and share your image.
- Work on your blog off-page SEO, on-page SEO, and technical SEO.
- Make your site content structure easy to read.
You can pitch website owners with similar niches and exchange links with them or wait for the organic traffic for about 3-5 months.
But the natural links are better as people who link to your content do this because they feel that your site may have some authority for publishing the content.
Types of blog niches where infographics are mainly used.
If you plan to make a website or blog alone, you should learn graphic design. And it is free. You have to watch a couple of youtube videos.
So here we are talking about the best website niches where most infographics are used, and if you are among the niches given below, you should learn this skill of making graphics.
Blogs and websites which use infographics most.
- Digital marketing.
- Parenting.
- Education.
- Business.
- Fashion.
- Lifestyle.
These are some significant niches under them. Hundreds of microniches can be used to make a blog.
FAQ about SEO infographics
What should be an ideal infographic size for the blog?
The ideal blog post infographic image should be 2000 px X 800 px. You can lower the size as per your blog post requirements.
How to get quality backlinks with infographics?
Infographics that contain well-researched data and information from authoritative sites can quickly get backlinks.
How much do infographics cost?
A graphics designer would take $5 – $25 to design an infographic image. You can hire a freelancer as well for this job.